

How to read the blood glucose performance summary charts and blood glucose test logs 19
19.How to read the blood glucose performance summary charts and blood glucose test logs.
● Blood Glucose Performance Summary Charts:
1) Tap ![]() to view the Blood glucose performance range summary chart home page.
to view the Blood glucose performance range summary chart home page. You can review blood glucose range analyses for the period
![]()
![]()
![]()
![]() by tapping on your selection.
by tapping on your selection. Slide Swipe the device screen to the left and right to toggle between pages to see additional analysis charts.
Color codes used to identify glycemic range: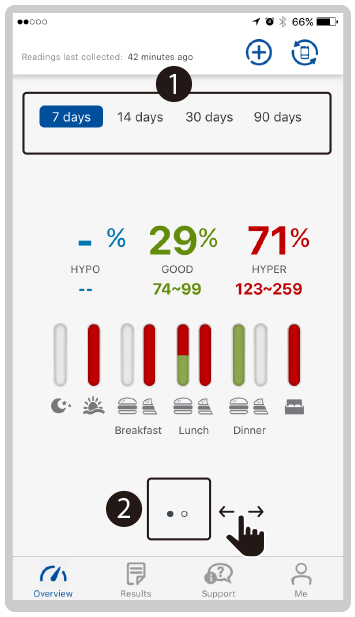
Color codes used to identify glycemic range: Green: Normal range
 Red: Hyperglycemic range
 Blue: Hypoglycemic range
2) A more detailed analysis chart is available to show the Average blood glucose range for the chosen analysis period.  Y axis: Shows the average value of your blood glucose test readings in mg or dL unit of measure.
 X axis: For Before or After Meal status at Breakfast, Lunch, Dinner, and at Midnight, Wake up, and Bedtime.


 The red area of the chart: Hyperglycemic range.
 The blue area of the chart: Hypoglycemic range.
※Note: The range will vary depending on the blood glucose goal range settings saved in ‘My Profile’.
3) Tap ![]() to view the blood glucose test logs.Shows the Blood glucose test date.Shows the number of times tested on that day and the combined average reading for that day (of all readings).Blood glucose test reading in (mg / dL). unit of measureThe time of day the Blood glucose test was completed.
to view the blood glucose test logs.Shows the Blood glucose test date.Shows the number of times tested on that day and the combined average reading for that day (of all readings).Blood glucose test reading in (mg / dL). unit of measureThe time of day the Blood glucose test was completed.
The ![]() icon showing under a blood glucose test reading are those that were synced automatically to the Rightest CARE App from the blood glucose meter. If there is no icon, the reading was entered manually into the Rightest CARE App.
icon showing under a blood glucose test reading are those that were synced automatically to the Rightest CARE App from the blood glucose meter. If there is no icon, the reading was entered manually into the Rightest CARE App.
 Note &Photo,
  Carbohydrates,
 Insulin Intake and
 Exercise icons showing under a test reading indicates that notes have been added to that reading.
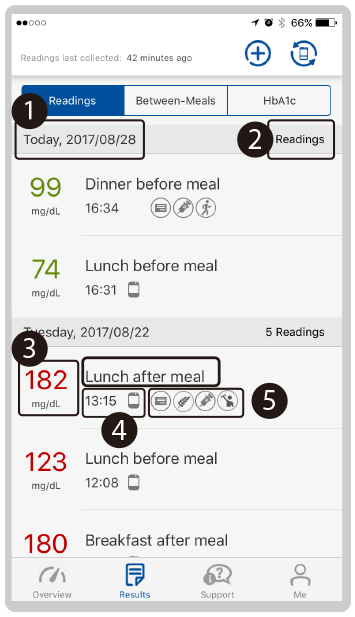
Color codes used to identify glycemic range:
Green: Normal rangeRed: Hyperglycemic rangeBlue: Hypoglycemic range
4) Tap ![]() ‘Between-Meals’ to view test readings that occurred between scheduled meal events.
‘Between-Meals’ to view test readings that occurred between scheduled meal events.
Shows Breakfast. Lunch. and Dinner testing events Before Meal and
  After Meal status marks
 Difference between blood glucose value before and after meals > 60mg.
 Difference between blood glucose value before and after meals < 30mg.
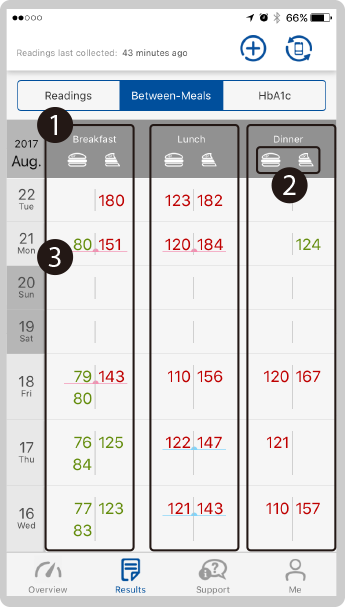
Color codes used to identify glycemic range:
Green: Normal rangeRed: Hyperglycemic rangeBlue: Hypoglycemic range
5) Tap 'HbA1c' to view readings. Shows the Latest HbA1c value. When your HbA1c is higher than 7%, it will be marked in red to alert you.
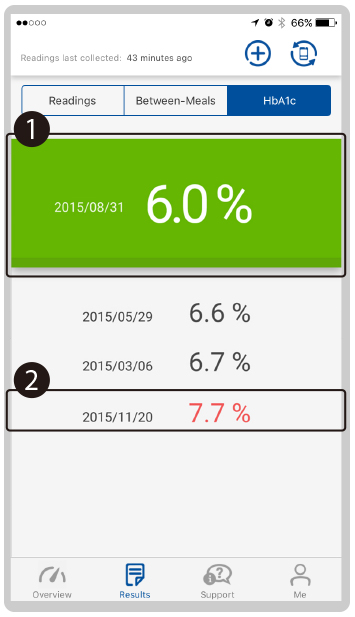
Notes: HbA1c totals can only be received from your health care provider. For more information, please call our customer service line.